
 BD Accuri™ C6
BD Biosciences
- Flow cytometry
- Cell Analyzer
- Detection of FITC, PE, PerCP-Cy5.5 and APC
- Learn More...
 CLARIOstar
BMG LABTECH
- AlphaScreen / AlphaLISA
- HTRF® & TR-FRET
- UV/vis , Fluorescence and luminescence reader
- Learn More...
 Ella
Ella
ProteinSimple
- Simple Plex
- Immunoassay technology / Lower cross-reactivity
- 8 Biomarkers / 25 ul sample
- Learn More...
IsoLight
IsoPlexis
- Biomarker analysis
- Cellular Proteomics system
- Single-cell secreted protein analysis
- Learn More...
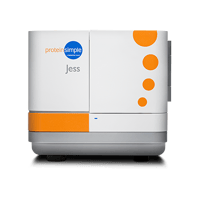
Jess
ProteinSimple
- Protein separation and immunodetection
- Automatic Western Blot
- Chemiluminescence and Fluorescence detection
- Learn More...
Luminex® 200
Luminex
- MultiAnalyte Profiling (MAP)
- xMAP Technology
- Custom Development
- Learn More...
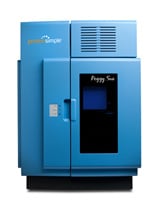 Peggy Sue
ProteinSimple
- Automated Capillary Immunoassay
- Protein separation by size and Charge
- Up to 96 samples / run
- Learn More...
 QuickPlex SQ 120
MSD
- Automated multiplex
- 5-log dynamic range
- Electrochemiluminescence (ECL)
- Learn More...
 SMCxPRO™
MilliporeSigma
- Ultrasensitive immunoassay platform
- Multiplexing analysis of Proteins
- Single Molecule Counting Technology
- Learn More...
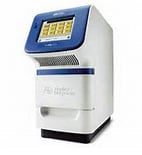
StepOne™ PCR
Applied Biosystems
- Real-Time PCR
- qPCR assays
- TaqMan and SYBR Green
- Learn More...
 WES
WES
ProteinSimple
- Protein Analysis
- Automatic Western Blot
- Highly reproducible immunoassay quantitation
- Learn More...
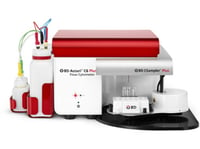
BD Accuri™ C6
Flow Cytometry
 Flow cytometry is a laser based, biophysical technology employed in cell counting, sorting, and biomarker detection and protein engineering, by suspending cells in a stream of fluid and passing them by an electronic detection apparatus. It allows simultaneous multi-parametric analysis of the physical and/or chemical characteristics of up to thousands of particles per second. SBH Sciences houses a BD Accuri™ C6 flow cytometer to assist us with your research needs and questions.
The system is equipped with a blue laser and a red laser, two scatter detectors, and four fluorescence detectors with interference filters optimized for the detection of FITC, PE, PerCP-Cy™5.5, and APC.
Flow cytometry can be a useful tool in many areas of research: immunology, cell and cancer biology, and microbiology. Additionally, Flow cytometry provides a powerful method for investigating cell signaling because the cells do not need to be lysed which is a prerequisite for many techniques. Researchers can first treat cells in a myriad of ways, then fix, stain with conjugated antibodies against cell surface and/or intracellular proteins (permeabilization required), and analyze the cells using flow cytometry.
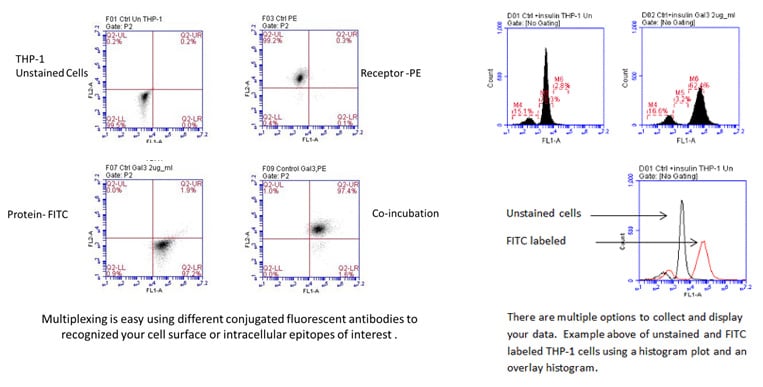
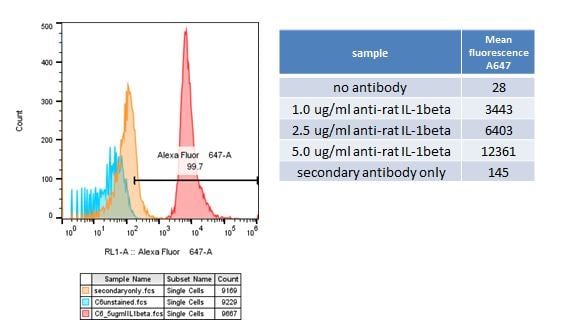
SBH Sciences scientists also have access to the Attune Nxt Acoustic Focusing Cytometer (Invitrogen) located in the Innovation Lab at ABI-LAB II. This flow cytometer has four lasers, blue 488nm, red 635 nm, violet 405 nm and yellow 561 nm and can perform compensation for your multi-fluorochrome experiments. A recent addition to the Innovation Lab is the Attune CytPix Flow Cytometer which only has two lasers , red and blue, but has a high-speed brightfield camera which captures sharp images of your cells as they pass through the flow cell helping you analyze only single cells and not doublets or debris. Below left is a histogram from a FACS analysis of C6 cells stained with 5 ug/ml rabbit anti-rat IL-1beta. An incremental increase in mean fluorescence was detected as the antibody concentration increased from 1 ug/ml to 5 ug/ml (table).
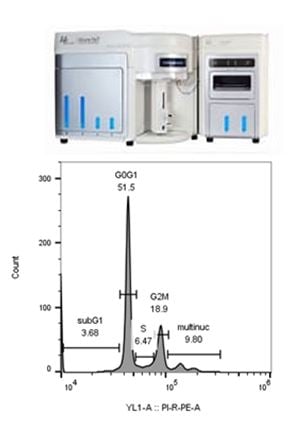
At SBH Sciences we have also performed FACS analyses to assist clients with their cell cycle, drug testing and quality assurance experiments. The histogram on the right is from Jurkat cells stained with PI/Rnase staining buffer. We also have detected numerous cytokine targets both with intracellular and surface staining and obtained high signal to noise ratios. Please contact us if you would need assistance with your FACS analysis experiments.
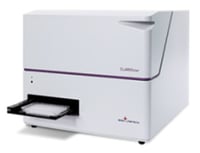
CLARIOstar
AlphaScreen® and AlphaLISA®
SBH Sciences has a newly acquired instrument, the CLARIOstar, to bring you even more versatility and assay options.
The CLARIOstar is BMG LABTECH's newest microplate reader and it is the only reader on the market available with the three technologies required to run any assay in your laboratory; patent-pending LVF monochromators, UV/vis spectrometer, and high transmission optical filters. The CLARIOstar does not compromise in sensitivity or flexibility, instead providing you with the tools to choose what is needed for your application.
Time Resolved Fluorescence (HTRF® & TR-FRET)
Time-Resolved Fluorescence Resonance Energy Transfer (TR-FRET) is a special form of resonance energy transfer (FRET) in which long emission fluorophores (lanthanides) are used as donors. The comparison measurement of the two emitted wavelengths over time is calculated for a TR-FRET response. The most common TR-FRET assays include HTRF®, LanthaScreen®, LANCE®, and Transcreener® ADP2 TR-FRET Red Assay.
AlphaScreen®
Amplified Luminescent Proximity Homogeneous Assay (Alpha) Technology, commonly known as AlphaScreen® and AlphaLISA®, is a bead-based detection mode which measures the interaction of two molecules bioconjugated to donor and acceptor beads. When excited at 680 nm, the donor bead produces singlet oxygen. If the acceptor bead is within a 200 nm distance, the singlet oxygen transfers energy to the donor resulting in production of light between 520 and 620 nm. The amount of produced light is directly proportionate to the amount of bound donor-acceptor beads. AlphaLISA is slightly different from AlphaScreen in that the primary emission occurs at 615nm.
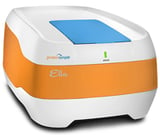
ELLA Simple Plex Platform
 SBH Sciences is among the first Contract Research Organizations World Wide that is offering contract services using the Simple Plex Platform (ELLA).
The Simple Plex platform is a transformative immunoassay technology which integrates an innovatively designed microfluidic cartridge with a state-of-the-art analyzer to deliver the most efficient benchtop immunoassay system along with reliable results. It brings a level of automation to the traditional ELISA by providing "sample-to-answer" test results in a sealed disposable cartridge within 1 hour while removing operator related biases. In addition, because of its unique multi-analyte capability with none of the drawbacks of traditional multiplex platforms, this platform has broad applicability in both research and clinical markets. We at SBH Sciences are offering both immunoassy platforms, the Luminex and the Simple Plex Platforms to meet customers' complete workflow in their research and clinical protein applications.
Customized Simple Plex cartridges can assay up to 8 analytes simultaneously in 75 minutes and require only 25ul of sample. All Simple Plex assays are fully validated, highly sensitive (picogram/ml), and feature up to 4 logs of dynamic range.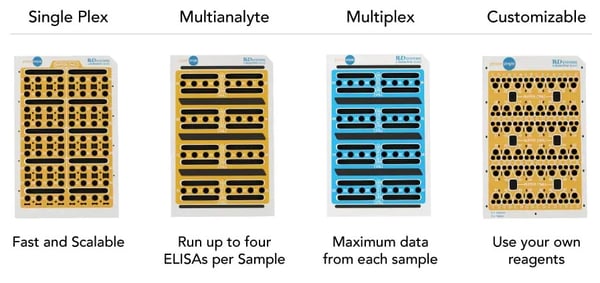
For example, the Simple Plex HEK 293 HCP 3G (SPCKB-OT-007066) assay on Ella offers broad detection coverage of the most relevant host cell proteins (HCPs).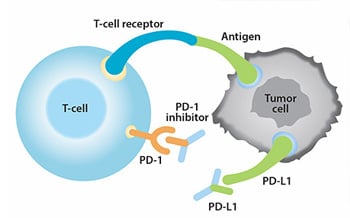
SBH Sciences is offering an accurate and sensitive measurement of PD-L1 using the Simple Plex. More than 175 validated analyses can be tested at SBH Sciences using this platform. Full list is available at:
http://www.proteinsimple.com/simple_plex_assays.html
Validated Simple Plex (ELLA) Analytes Available for Immediate Use.
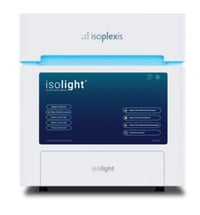
IsoLight
IsoPlexis Single-Cell Functional Proteomics
SBH Sciences in conjunction with Isoplexis is offering biomarker analysis using the Isolight.
Please contact us with any question. We would be delighted to work with you.
High-Impact Applications
IsoPlexis' highly multiplexed single-cell and bulk proteomic solutions provide comprehensive immune profiling for a range of diseases and research areas, from infectious disease to cell therapy and cancer immunology. Available for human, mouse, and non-human primate model systems, IsoPlexis' solutions provide a flexible platform that can support a variety of applications from early-stage R&D through clinical trials. A detailed list of panels is available here.

|

|

|
| Single-Cell Secretome | Single-Cell Signaling | CodePlex |
IsoPlexis' Unique Biology
IsoPlexis' Functional Proteomics platform reveals the rare subsets of highly-polyfunctional cells that simultaneously secrete multiple cytokines. These highly functionally active cells have been shown to be predictive of patient response and disease progression in vivo. Traditional technologies can estimate cellular function at the population level, but these estimates do not reflect differences in that population's function. IsoPlexis' system is the only technology able to phenotype each immune cell by its extracellular function, revealing the unique power of the individual cell.
Learn More

The Functional Cell Library
IsoPlexis developed a new library of cells characterized by functional proteomics to complement the genomic-based Human Cell Atlas. The Functional Cell Library (FCL) adds a unique layer of proteomic data on the wide range of superpowered immune and tumor cell types uniquely identified by IsoPlexis' Single-Cell Functional Proteomics.
Unlock The Functional Cell Library
Please contact us so we can discuss your specific needs, we will be happy to assist you.
Luminex® 200
Luminex / Multiplex Services
 MULTIPLEX
Custom Development and Testing Services of MultiAnalyte Profiling (MAP)
SBH Sciences is offering Multiplex Cytokines Custom Development and Testing Services based on our Cytokine expertise and the Luminex® xMAP Technology. The xMAP platform technology allows simultaneous quantification of MultiAnalyte Profiling including cytokines / chemokines / biomarkers in cell culture and biological samples. We are offering tailor-made assay development of Multi Arrays usually based on already available commercial assays as well as additional of new innovative biological markers. We will develop the assay and will evaluate, verify and optimize the dynamic range, signal linearity, assay specificity and will ensure Multiplex compatibility. We are also providing Customer Sample Testing Services.
Our custom assays can be tailor-made for many applications including: Cancer Markers, Cardiac Markers, Growth Factors and Transcription Factors. It might assist to assess the mechanism of action for monoclonal antibodies, recombinant proteins, small molecule therapeutics across a range of disease states including cardiovascular, inflammation, immunology, oncology, and CNS disorders.
Our expertise in the production and purification will be applied as well. For example, SBH Sciences can assist you in the isolation of specific biomarker from natural sources or produce it as a recombinant protein while simultaneously, we will also develop your specific MultiAnalyte Method.
We are using the Luminex® 200™ analyzer (Luminex and Luminex 200 are registered trademarks of Luminex Corporation). We also can perform Cell-Based assays for you samples using over 400 different cell lines. Please see our unique Cytokine Bioassay Services.
Please contact us so we can discuss your specific needs, we will be happy to assist you.
Luminex Analytes Tested and Available for Immediate Use
SBH Sciences has performed comprehensive testing on the 58 analytes below with 36 validated assays already completed.
If you need analysis of a biomarker that is not currently available on our list, please contact us. We will be happy to assist you.
| Biomarker | Validated | Human | Mouse | Potential Biomarker for: |
| CD40 ligand (soluble) | + | Alzheimer's | ||
| chemokine (C-X-C motif) ligand 1 (CXCL1) |
+ | + | Melanoma | |
| chemokine (C-X-C motif) ligand 2 (CXCL2) |
+ | Asthma | ||
| EGF | + | Glomerular Disease, Parkinson's Disease | ||
| Eotaxin / CCL11 | + | + | Neurodegenerative Diseases | |
| Eotaxin-3 / CCL26 | + | + | Churg-Strauss syndrome, Inflammatory Diseases | |
| FGF-basic | + | + | Renal disease | |
| Flt-3 ligand | + | Gastrointestinal non-Hodgkin's lymphoma | ||
| Fractalkine | + | Inflammation, Crohn's Disease | ||
| G-CSF | + | Cardiovascular | ||
| GM-CSF | + | + | Rheumatoid Arthritis | |
| GRO | + | Inflammation | ||
| ICAM-1 | + | + | Alzheimer's disease, Inflammation | |
| IFN-alpha | + | Autoimmune diseases | ||
| IFN-gamma | + | + | Autoimmune diseases | |
| IL-1alpha | + | + | Rheumatoid Arthritis/Alzheimer's | |
| IL-1RA | + | Auto inflammatory syndrome, inflammatory vascular disease | ||
| IL-1beta | + | + | + | Inflammation |
| IL-2 | + | + | Immune responses | |
| IL-2RA | + | Inflammation | ||
| IL-3 | + | Hodgkin's disease | ||
| IL-4 | + | + | + | Allergies/Inflammation |
| IL-5 | + | + | Inflammatory Diseases | |
| IL-6 | + | + | + | Inflammatory/Immune Responses |
| IL-7 | + | + | Hodgkin's disease | |
| IL-8 | + | + | Cardiovascular disease, Inflammation | |
| IL-9 | + | Crohn's disease, Inflammation | ||
| IL-10 | + | + | + | Autoimmune diseases, Inflammation |
| IL-12 p40 | + | + | + | Autoimmune diseases |
| IL-12 p70 | + | + | Autoimmune diseases | |
| IL-13 | + | + | Asthma | |
| IL-15 | + | + | Cancer | |
| IL-16 | + | Whipple Disease | ||
| IL-17A | + | + | + | Rheumatoid Arthritis/Psoriasis/Multiple Sclerosis |
| IP-10 | + | + | Tuberculosis, HIV infection, Alzheimer's | |
| Leptin | + | Alzheimer's disease, Vascular, Autoimmune | ||
| LIF | + | Inflammatory/Immune Responses | ||
| MIP-1alpha / CCL3 | + | + | Inflammatory Responses | |
| MIP-1beta / CCL4 | + | + | Chronic Inflammation/Liver Damage | |
| MCP-1 / CCL2 | + | + | + | Inflammation, Diabetes |
| MCP-3 / CCL7 | + | Inflammation | ||
| MCP-4 / CCL13 | + | + | Asthma | |
| MDC / CCL22 | + | + | Inflammation | |
| PIGF | + | + | Early Pregnancy Location | |
| PDGF-AA | + | Renal disease | ||
| PDGF-AB/BB | + | Renal disease | ||
| RANTES / CCL5 | + | Renal disease | ||
| TARC / CCL17 | + | + | Related to thymus | |
| Tie-2 | + | + | Endothelial diseases | |
| TGF-alpha | + | Menetrier's disease, kidney disease | ||
| TNF-alpha | + | + | + | Inflammation, Diabetes, Obesity |
| TNF-beta | + | + | Inflammation, antiviral responses | |
| TNF-RI | + | + | Autoimmune | |
| TNF-RII | + | + | Autoimmune | |
| VCAM-1 | + | + | Diabetes, Cardiovascular Disease | |
| VEGF | + | Alzheimer's disease | ||
| VEGF-A | + | + | Carcinoma, Breast Cancer | |
| VEGF-D | + | + | Carcinoma, Breast Cancer |
Automated Western Blot
Jess, Peggy Sue, Wes
Automated Western Blot Analysis Services
A major challenge in protein research is obtaining rapid, quantitative, reproducible, high-content information.
Since 2013 SBH Sciences and SBH Diagnostics have offered innovative, automated Simple Western Blot services using the PeggySue, WES and JESS (ProteinSimple) systems. This technology is based on novel protein separation using capillary electrophoresis (CE) and highly accurate immunodetection. Proteins can be separated by size, as in traditional PAGE westerns, or by pI, as in traditional CE or isoelectric focusing.
This service is especially suited to pharmaceutical and biotech companies using traditional western blots in their research, development, and QC labs. Simple Western has applications in vaccine development, kinase inhibitor, cell lysate analysis (from tissue culture or tumors), and the identification and quantitation of tumor-associated proteins in clinical patient samples.
View our Simple Western™ Case Studies on the SBH Diagnostics site.
|
|
|
| Jess | Peggy Sue | Wes |
Benefits of the Automated Western Service
- Quantitative reproducible protein analysis with CVs under 10%
- High-throughput capability
- Ability to multiplex and normalize results to standard proteins
- Efficient and cost-effective
The Simple Western™ Protein Analysis can provide:
- Protein quantification and characterization
- Protein Charge Heterogeneity analysis
- Protein Formulation & Stability Testing
- Antibody and Antibody Drug-Conjugate Characterization
- Gel and Blot Documentation
- Multiplexed Protein Analysis
- Post-Translational Modification Characterization
- Evaluation of novel therapeutics against key cancer-associated target proteins in kinase signaling pathways
- Stratification of patient populations for clinical trials
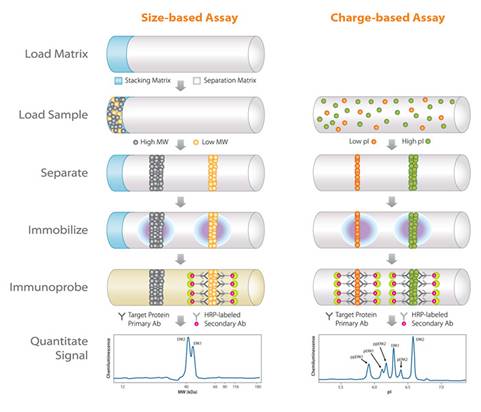
Size/charge-based characterization of proteins has traditionally been performed by either SDS-PAGE/IEF/Western blot or by capillary electrophoresis (CE). Each technique has advantages; western blotting delivers high sensitivity and specificity, while CE offers high resolution and reproducibility. However, a challenge in obtaining optimal results is the need to preconcentrate or stack enough protein sample before separation. Simple Western is a new size-based or charge-based separation platform that combines the advantages of both Western blotting and CE into a single automated workflow. Optimization of stacking conditions results in a significant increase in both sensitivity and resolution.
Please contact us to discuss your protein separation and detection needs, and how our services can provide solutions.
MSD QuickPlex SQ 120
The QuickPlex SQ 120 is an automated plate reader similar to the LUMINEX and ELLA designed for electrochemiluminescence immunoassays. It has a high sensitivity detection system detecting as low as 0.05pg/mL, a 5-log dynamic range and multiplexing capabilities. The main advantage the QuickPlex SQ 120 has over the ELLA and LUMINEX is its higher throughput. It can read a 96-well plate in 3 min versus Luminex and ELLA which can take 1.5 - 2 hours per plate.
There are 5 different assay types that the QuickPlex SQ 120 can run. The assay styles are R-Plex, S-Plex, T-Plex, U-Plex, and V-Plex. Each has a different optimization such as customization, validation, and ultrasensitive detection.
Please contact us with any inquiry and we would be delighted to assist you.
SMCxPRO™ Platform from MilliporeSigma
Single Molecule Counting (SMC™) for your ultrasensitive biomarker needs SBH Sciences offers bioanalytical services for biomarker and large molecule analysis using the ultrasensitive Single Molecule Counting (SMC™) Technology. We offer a menu of MilliporeSigma SMC™ ultrasensitive biomarker assays and provide the following services:
- Biomarker Quantitation
- Pharmacokinetics and Pharmacodynamics (PK/PD)
- Immunogenicity (ADA)
- Assay Development
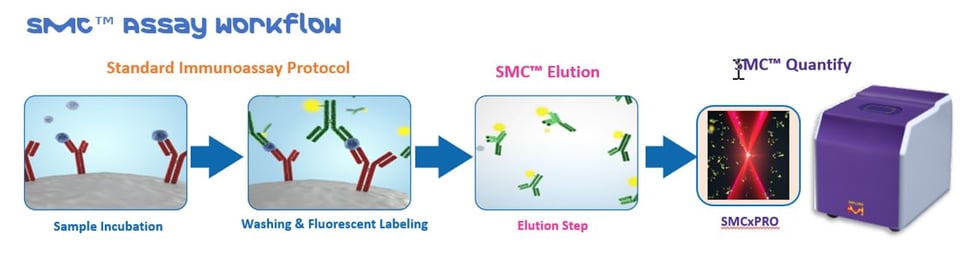
SMC™ Technology Workflow
The SMC™ Technology provides enhanced quantification at both low and high levels of expression. The immunoassay uses traditional ELISA technology, combined with a unique assay elution step. The eluted fluorescently labeled detection antibodies are digitally counted on the SMCxPRO™ and the data is computed against a known concertation providing a quantitative measurement of the target analytes in the biological sample (e.g., CSF, serum, plasma).
With the SMCxPRO™ platform, you can detect extremely low-levels of established disease biomarkers, capturing concentrations down to the femtogram/mL level, and as a result monitor small changes in protein concentrations to accurately measure biomarkers associated with disease progression.
In addition, the small sample volume requirements allow you to conserve valuable samples, reduce program costs and improve productivity.
Please contact us with any inquiry and we would be delighted to assist you.
Verification Criteria for SMC™ Immunoassays
The SMC™ high sensitivity detection system addresses the needs of researchers who require highly quantitative, accurate, and robust biomarker assays. Our assays are rigorously developed and tested in matrix by multiple operators over multiple days.
A comprehensive set of criteria evaluating ultimate quantitative performance are used to qualify verified immunoassays, including:
Lower Limit of Quantification
Lowest point on the standard curve where CV is <20% and accuracy is within 20% of expected values.
Inter- and Intra- Assay Precision
Same samples run on multiple plates over multiple days to ensure reproducibility. Spiked and un-spiked samples report values within 20% across experiments.
Spike Recovery
Analyte added at the lower end of the standard curve to ensure accurate measurements for real samples. Minimum of 10 samples spiked with acceptable recovery between 80-120%.
Dilutional Linearity
Spiked samples diluted through at least 3 dilutions. Minimum of 10 samples spiked and diluted with acceptable recovery between 80-120%.
Dynamic Range
Assays target a quantifiable range of 3-4 logs.
Endogenous Range
Minimum of 10 samples from individual donors assessed for ability to quantify baseline biomarker levels.
Learn more about SMC™ technology at SigmaAldrich.com/smc
MilliporeSigma SMCTM Assay Offering the analysis of the following Analytes
Key: H=Human; M=Mouse; R=Rat; GP=Guinea Pig; Cy=Cynomolgus Monkey; C=Canine
|
Analyte |
LLoQ |
Standard Curve Range (pg/mL) |
Median Endogenous (pg/mL)2 |
Species3 |
Sample Types4 |
Sample volume (μL) |
|
Phospho-α-Synuclein(Ser129)6,7 |
0.1 |
0.05-50 |
P: 2.74 |
H |
P,S,C |
20, 20, 50 |
|
Total-α-Synuclein6,7 |
1.95 |
0.49-500 |
P: 1885 |
H |
P,S,C |
0.5, 0.5, 10 |
|
Phospho-Akt1 (Ser473) |
0.98 |
1.0-1000 |
NA |
H, M, R |
L |
varies8 |
|
Total Akt1 |
7.80 |
1.0-1000 |
NA |
H, M, R |
L |
varies8 |
|
Amyloid beta 1-406,7 |
5.86 |
2.93-3000 |
Normal CSF: 1366 |
H, M, R |
C, P |
5, 25 |
|
Amyloid beta 1-426,7 |
0.98 |
0.24-250 |
Normal CSF: 192 |
H, M, R |
C, P |
5, 25 |
|
BDNF6,7 |
0.04 |
0.02-100 |
P: 783 |
H |
C, P, S |
100, 1, 1 |
|
cTnI 6,7 |
0.69 |
0.17-600 |
P: 3.04 |
H, Cy, R, C, GP |
P, S |
100 |
|
G-CSF |
0.08 |
0.02-20 |
17 |
H |
P |
10 |
|
GFAP6,7 |
0.12 |
0.06-300 |
P: 1.91 |
H |
C, P, S |
3.3, 100, 100 |
|
GLP-1 (active) |
0.40 |
0.05-50 |
3.46 |
H, M, R, C |
P |
100 |
|
GLP-1 (total) |
0.39 |
0.20-200 |
17.8 |
H, M, R, C |
P |
20 |
|
Glucagon6,7 |
0.78 |
0.20-200 |
44 |
H, M, R |
P |
10 |
|
GM-CSF |
0.02 |
0.005-5 |
0.2 |
H |
P |
100 |
|
IFN-α26,7 |
0.031 |
0.015-80 |
P: 0.08 |
H |
P,S |
100 |
|
IFN-β1 |
0.15 |
0.07-170 |
P: 0.35 |
H |
P,S |
50 |
|
IFN-γ6,7 |
0.03 |
0.016-25 |
P: 1.4 |
H |
P, S |
25 |
|
IL-1α26,7 |
0.12 |
0.06-60 |
P: 0.09 |
H |
P,S |
100 |
|
IL-1β6,7 |
0.20 |
0.05-50 |
P: 0.11 |
H |
P,S |
100 |
|
IL-2 (new version) |
0.09 |
0.02-80 |
0.21 |
H |
P, S |
100 |
|
IL-21 |
0.20 |
0.11-250 |
0.53 |
H |
S |
50 |
|
IL-226,7 |
0.10 |
0.05-50 |
P: 1.51 |
H |
P,S |
25 |
|
IL-236,7 |
0.10 |
0.1-100 |
P: 0.65 |
H |
P,S |
100 |
|
IL-46,7 |
0.04 |
0.01-10 |
P: 0.18 |
H |
P,S |
100 |
|
IL-56,7 |
0.04 |
0.05-50 |
P: 0.37 |
H |
P,S |
100 |
|
IL-66,7 |
0.08 |
0.01-50 |
P: 0.70 |
H |
P, S |
75 |
|
IL-7 |
0.39 |
0.10-100 |
4.91 |
H |
P, S |
50 |
|
IL-8 / CXCL8 |
0.24 |
0.24-250 |
3.6 |
H |
P, S |
50 |
|
IL-106,7 |
0.10 |
0.10-100 |
P: 0.90 |
H |
P,S |
100 |
|
IL-12p706,7 |
0.05 |
0.05-50 |
P: 0.29 |
H |
P, S |
100 |
|
IL-136,7 |
0.04 |
0.02-100 |
P: 0.37 |
H |
P,S |
100 |
|
IL-15 |
0.10 |
0.02-25 |
3.38 |
H |
P, S |
100 |
|
IL-17A/F Heterodimer6,7 |
1.17 |
0.60-600 |
P: 1.36 |
H |
P,S |
50 |
|
IL-17A6,7 |
0.07 |
0.02-60 |
P: 0.31 |
H |
P, S |
50 |
|
IL-17F6,7 |
0.20 |
0.10-100 |
P: 1.10 |
H |
P, S |
50 |
|
IL-186,7 |
0.09 |
0.04-100 |
P: 138 |
H |
P,S |
10 |
|
KIM-15 |
3.91 |
1.0-1000 |
P: 65 |
H |
P, S, U |
25, 25, 5 |
|
MCP-16,7 |
0.15 |
0.06-400 |
P: 682 |
H |
P,S |
1.56 |
|
NGFβ6,7 |
0.017 |
0.09-200 |
P: 1.20 |
H |
P,S |
50 |
|
NPTX26,7 |
0.58 |
0.29-1000 |
P: 8268 |
H |
P,S,C |
0.1, 0.1, 0.3 |
|
Phospho-Tau(Thr181)6,7 |
0.94 |
0.23-240 |
P: 3.4 |
H |
P,S,C |
50, 100, 25 |
|
Total Tau6,7 |
2.34 |
1.17-1200 |
P: 27.1 |
H |
P,S,C |
50, 100, 25 |
|
TNFα |
0.40 |
0.05-50 |
38.6 |
M |
S |
25 |
|
TNFα6,7 |
0.20 |
0.05-50 |
P: 0.85 |
H |
P,S |
100 |
|
TSLP6,7 |
1.56 |
0.78-800 |
P: 5.04 |
H |
P,S |
100 |
|
UCHL16,7 |
2.60 |
1.30-2000 |
P: 22.06 |
H |
P,S,C |
25,25,5 |
|
VEGF-A6,7 |
0.20 |
0.10-100 |
P: 48 |
H |
P,S |
25 |
|
SARS-CoV-2 RBD IgG |
NA9 |
NA9 |
NA9 |
H |
P,S |
2 |
|
SARS-CoV-2 S1 IgA |
NA9 |
NA9 |
NA9 |
H |
P,S |
2 |
1 - LLoQ: Lowest point on standard curve that meets the following criteria for all sample types claimed: CV < 20% and accuracy within 20% of expected values, reproducible across at least three assay runs across three different operators.
2 - Median Endogenous: Minimum of 10 samples from individual donors assessed for ability to quantify baseline biomarker values.
3 - Optimized for first species type listed. Other listed species have been tested, but not optimized for peak performance.
4 - Optimized for use in sample type(s) listed. Key: P=Plasma; S=Serum; L=Lysate; U=Urine; C=Cerebrospinal Fluid (CSF)
5 - Plate-based assay
6 - Assay characteristic data is representative for both Erenna® and SMCxPRO™.
7 - Streamlined format kit.
8 - Sample volume varies based on dilution factor selected by user
9 - Qualitative assay
StepOnePlus™ Real-Time PCR System
qPCR Services Our laboratory utilizes the Applied Biosystems StepOne PlusTM Real-Time PCR system. We have extensive experience designing and performing qPCR assays using both TaqMan and SYBR green detection chemistries.
Our qPCR workflow involves RNA extraction and QC, cDNA conversion, primer design and validation (if necessary), reference gene optimization and data analysis. Our SYBR Green primer design and validation service involves optimization for amplicon size and primer specificity using both gel electrophoresis and melting curve analysis. We also perform an analysis of the efficiency of amplification for our designed primer sets. Our gene expression analysis generates a report detailing differential gene expression across the dataset using the comparative Ct methodology between control and treated samples.
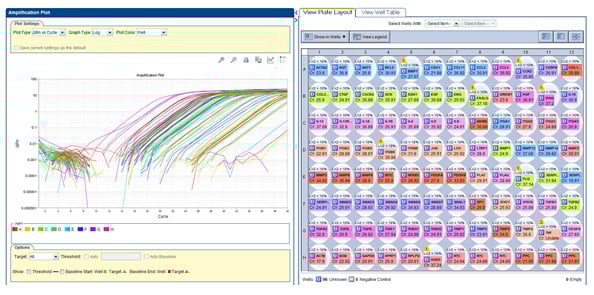
Using real-time PCR, you can easily analyze the expression of a group of genes. The picture above is an example of treated LC-11 cells that were run using Qiagens' Human Fibrosis RT2Profile PCR Array.